Research · VPN Buyer Intent Study 2026

VPN Buyer Intent Study 2026: What 10,907 VPN.com visitors want from a VPN

Key findings

  • 32.5%Speed is the #1 priority
  • 20.5%One in five can't say what they'd use a VPN for
  • 53.9%More than half aren't sure what to spend
  • 74%Three in four finish the quiz
  • 21% to 73%Budget confidence swings by country
  • 31.2%Almost a third visit a provider within a week

Full sentences, sample sizes and citations

What do VPN.com visitors say they want from a VPN: what they would use it for, what matters most to them and what they would spend?

Data
Jul 29, 2026 to Oct 18, 2026. 14,792 visitors to VPN.com's VPN finder quiz started the quiz and 10,907 (74%) answered all three questions, on a first or a later attempt. Not a census of all VPN users.
Status and disclosure
Industry research with open data; not peer reviewed. VPN.com earns an affiliate commission when visitors buy through our links, including some of the clicks this study measures. How that affects the data
Published
Michael Gargiulo, Founder, CEO & Lead Domain Broker, VPN.com. October 19, 2026. Updated . Version 1.0. Press: press@vpn.com
Contents

1 · Key findings

11 findings at a glance

Open any card for the full sentence and a citation you can copy.

32.5%

Speed is the #1 priority

n = 10,907 · Jul 29, 2026 to Oct 18, 2026

Cite this statistic

32.5% of the 10,907 visitors who finished put Speed first, ahead of Privacy (18.3%) and Price (17.0%).

Priorities differ sharply by country, and a pooled share reflects the biggest audiences. Speed is first in 4 of the 8 countries with 200 or more finishers; Price comes first in the United States, China, and Hong Kong, and Privacy comes first in Indonesia.

32.5% of the 10,907 visitors who finished put Speed first, ahead of Privacy (18.3%) and Price (17.0%). (VPN.com, VPN Buyer Intent Study 2026; n = 10,907; Jul 29, 2026 to Oct 18, 2026.) https://www.vpn.com/research/vpn-buyer-intent-2026/#stat-h05

20.5%

One in five can't say what they'd use a VPN for

n = 14,792 · Jul 29, 2026 to Oct 18, 2026

Cite this statistic

20.5% of 14,792 visitors chose "I'm not sure" when asked what they would use a VPN for.

The share depends partly on how prominent the "not sure" option is.

20.5% of 14,792 visitors chose "I'm not sure" when asked what they would use a VPN for. (VPN.com, VPN Buyer Intent Study 2026; n = 14,792; Jul 29, 2026 to Oct 18, 2026.) https://www.vpn.com/research/vpn-buyer-intent-2026/#stat-h04

53.9%

More than half aren't sure what to spend

n = 10,907 · Jul 29, 2026 to Oct 18, 2026

Cite this statistic

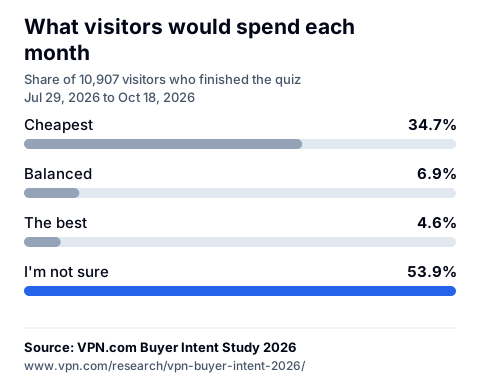
53.9% of 10,907 finishers answered "I'm not sure" when asked for a monthly budget; 34.7% of all finishers picked the cheapest option.

The budget options carry no dollar amounts, so "Balanced" and "The best" are relative. The "not sure" share was higher before Aug 18, 2026, when that option changed: 64% before and 51% since.

53.9% of 10,907 finishers answered "I'm not sure" when asked for a monthly budget; 34.7% of all finishers picked the cheapest option. (VPN.com, VPN Buyer Intent Study 2026; n = 10,907; Jul 29, 2026 to Oct 18, 2026.) https://www.vpn.com/research/vpn-buyer-intent-2026/#stat-h06

74%

Three in four finish the quiz

n = 14,792 · Jul 29, 2026 to Oct 18, 2026

Cite this statistic

14,792 people started VPN.com's VPN finder quiz and 10,907 (74%) answered all three questions, on a first or a later attempt.

Counts only visitors who answered the first question, and counts a visitor as finished if they finished on any attempt. On the first attempt alone, 72% finished.

14,792 people started VPN.com's VPN finder quiz and 10,907 (74%) answered all three questions, on a first or a later attempt. (VPN.com, VPN Buyer Intent Study 2026; n = 14,792; Jul 29, 2026 to Oct 18, 2026.) https://www.vpn.com/research/vpn-buyer-intent-2026/#stat-h01

21% to 73%

Budget confidence swings by country

n = 6,138 · Jul 29, 2026 to Oct 18, 2026

Cite this statistic

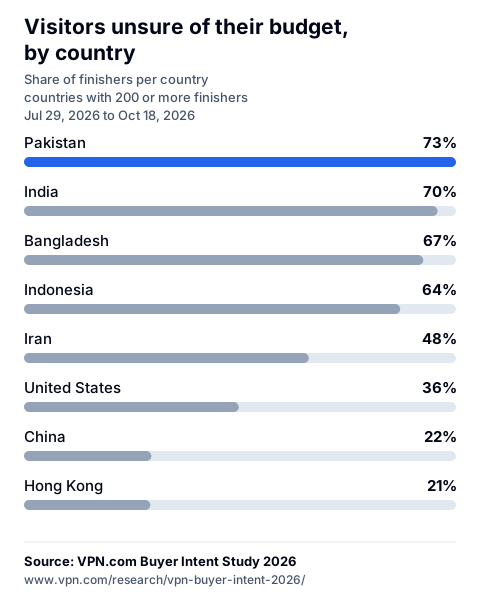
The share unsure of their budget ranged from 21% in Hong Kong (n = 361) to 73% in Pakistan (n = 1,373), across the 8 countries with 200 or more finishers.

Countries differ in language, device and the pages that send them traffic. The card's n is all finishers in those countries.

The share unsure of their budget ranged from 21% in Hong Kong (n = 361) to 73% in Pakistan (n = 1,373), across the 8 countries with 200 or more finishers. (VPN.com, VPN Buyer Intent Study 2026; n = 6,138; Jul 29, 2026 to Oct 18, 2026.) https://www.vpn.com/research/vpn-buyer-intent-2026/#stat-h14

31.2%

Almost a third visit a provider within a week

n = 10,001 · Jul 29, 2026 to Oct 18, 2026

Cite this statistic

31.2% of visitors who finished the quiz clicked through to a provider's site within seven days.

A click-out is interest, not a purchase.

31.2% of visitors who finished the quiz clicked through to a provider's site within seven days. (VPN.com, VPN Buyer Intent Study 2026; n = 10,001; Jul 29, 2026 to Oct 18, 2026.) https://www.vpn.com/research/vpn-buyer-intent-2026/#stat-h18

Show the other 5 findings

2.2×

Price-first visitors want the cheapest plan

n = 1,851 · Jul 29, 2026 to Oct 18, 2026

Cite this statistic

Visitors who ranked Price first were 2.2 times as likely as the average visitor to choose the cheapest budget (76.0% vs 34.7%).

An association between answers, not a cause.

Visitors who ranked Price first were 2.2 times as likely as the average visitor to choose the cheapest budget (76.0% vs 34.7%). (VPN.com, VPN Buyer Intent Study 2026; n = 1,851; Jul 29, 2026 to Oct 18, 2026.) https://www.vpn.com/research/vpn-buyer-intent-2026/#stat-h07

2.3×

Visitors wanting privacy put Privacy first

n = 2,083 · Jul 29, 2026 to Oct 18, 2026

Cite this statistic

Visitors who wanted a VPN for privacy were 2.3 times as likely as average to rank Privacy their top priority (41.3% vs 18.3%).

An association between answers, not a cause.

Visitors who wanted a VPN for privacy were 2.3 times as likely as average to rank Privacy their top priority (41.3% vs 18.3%). (VPN.com, VPN Buyer Intent Study 2026; n = 2,083; Jul 29, 2026 to Oct 18, 2026.) https://www.vpn.com/research/vpn-buyer-intent-2026/#stat-h08

1.4×

Gamers lean toward speed

n = 1,538 · Jul 29, 2026 to Oct 18, 2026

Cite this statistic

Gamers were 1.4 times as likely as the average visitor to put Speed first (46.7% vs 32.5%).

An association between answers, not a cause.

Gamers were 1.4 times as likely as the average visitor to put Speed first (46.7% vs 32.5%). (VPN.com, VPN Buyer Intent Study 2026; n = 1,538; Jul 29, 2026 to Oct 18, 2026.) https://www.vpn.com/research/vpn-buyer-intent-2026/#stat-h09

1.6×

Doubt on one question carries to the next

n = 2,152 · Jul 29, 2026 to Oct 18, 2026

Cite this statistic

Visitors unsure what matters most were 1.6 times as likely as average to be unsure about budget too (83.8% vs 53.9%).

An association between answers, not a cause.

Visitors unsure what matters most were 1.6 times as likely as average to be unsure about budget too (83.8% vs 53.9%). (VPN.com, VPN Buyer Intent Study 2026; n = 2,152; Jul 29, 2026 to Oct 18, 2026.) https://www.vpn.com/research/vpn-buyer-intent-2026/#stat-h10

68.0%

Streaming-page visitors are after shows from abroad

n = 206 · Oct 3, 2026 to Oct 19, 2026 · smaller sample

Cite this statistic

68.0% of 206 visitors to our streaming page said their show is only available abroad.

Smaller sample; mostly English- and Chinese-language pages.

68.0% of 206 visitors to our streaming page said their show is only available abroad. (VPN.com, VPN Buyer Intent Study 2026; n = 206; Oct 3, 2026 to Oct 19, 2026.) https://www.vpn.com/research/vpn-buyer-intent-2026/#stat-h21

Smaller-sample findings are marked; quote them with their sample size.

2 · Why they want a VPN

One in five visitors isn't sure what they'd use a VPN for

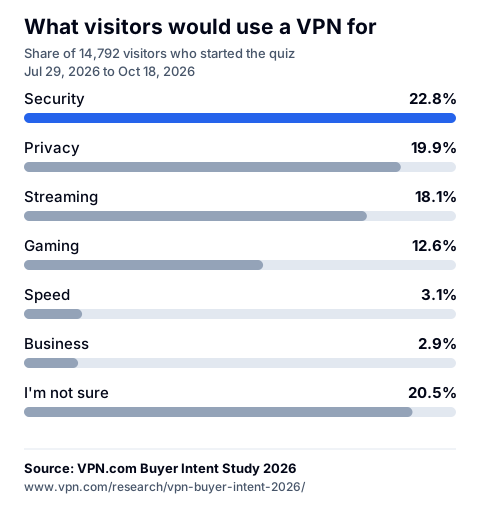
We asked "What will you use a VPN for?" of the 14,792 visitors who started the quiz.

20.5% chose "I'm not sure". Among those who did name a purpose, Security was the most common answer before Speed was added: 24.1% of 11,819 visitors, ahead of Privacy at 20.9%.

On October 4, 2026 we added a sixth option, Speed, and 15.3% of the 2,973 visitors since then have chosen it. That shows how people respond to the options on offer, not a separate need for speed.

The question as asked, October 2026. Speed was added on Oct 4, 2026.
Drawn from the dataset; the same figures are in the table. Select the chart to enlarge it.

SVG

All visitors, Jul 29, 2026 to Oct 18, 2026 (n = 14,792)
AnswerBarShare of visitors95% intervaln
Security22.8%22.2% to 23.5%3,378
Privacy19.9%19.3% to 20.6%2,946
Streaming18.1%17.5% to 18.8%2,682
Gaming12.6%12.1% to 13.2%1,870
Speed3.1%2.8% to 3.4%454
Business2.9%2.6% to 3.1%423
I'm not sure20.5%19.9% to 21.2%3,039
Before and after Speed was added
AnswerFive optionsuntil Oct 3, 2026 · n = 11,819Six optionsfrom Oct 4, 2026 · n = 2,973
Security24.1%17.6%
Privacy20.9%15.9%
Streaming18.8%15.6%
Gaming13.2%10.5%
Speed–15.3%
Business3.0%2.5%
I'm not sure20.0%22.7%

The same visitors were asked what matters most in a separate question, so the Speed share here and the Speed share below measure different things. The order of the options and the one-line description under each can nudge a first answer.

3 · What matters most

Speed comes first, ahead of Privacy and Price

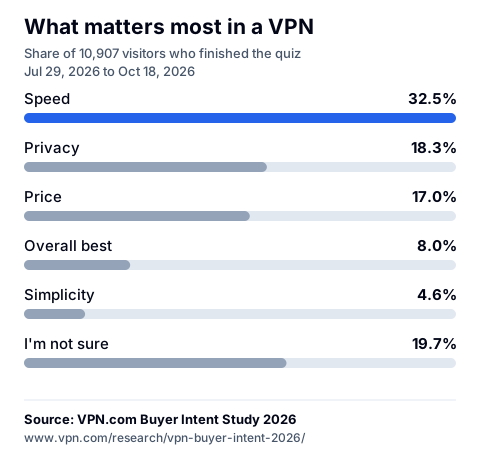
We asked "What matters most in a VPN?" of the 10,907 visitors who finished the quiz.

32.5% put Speed first. Privacy followed at 18.3% and Price at 17.0%, while 19.7% said "I'm not sure".

Priorities differ sharply by country, so a pooled share mostly reflects the countries that send the most visitors. Speed is first in 4 of the 8 countries with 200 or more finishers; Price comes first in the United States, China, and Hong Kong, and Privacy comes first in Indonesia. Without Pakistan and India, the two largest audiences, Speed is still first at 31.1% of 8,409 finishers, ahead of Price (19.7%). Treat the pooled share as a description of this audience, not of VPN users everywhere.

Drawn from the dataset; the same figures are in the table. Select the chart to enlarge it.

SVG

All finishers (n = 10,907)
AnswerBarShare of visitors95% intervaln
Speed32.5%31.6% to 33.4%3,541
Privacy18.3%17.5% to 19.0%1,992
Price17.0%16.3% to 17.7%1,851
Overall best8.0%7.5% to 8.5%870
Simplicity4.6%4.2% to 5.0%501
I'm not sure19.7%19.0% to 20.5%2,152

4 · What they would spend

More than half aren't sure what to spend

We asked "What's your monthly budget?" of the 10,907 visitors who finished the quiz.

53.9% of all finishers chose "I'm not sure". Of all finishers, "Cheapest" led among the named budgets at 34.7%, followed by "Balanced" (6.9%) and "The best" (4.6%). Among only the 5,033 who named a budget, 75.2% chose "Cheapest", 14.9% chose "Balanced", 9.9% chose "The best".

For a visitor still comparing providers, that uncertainty is the opening: many of these visitors arrive without a price in mind. The options carry no dollar amounts, so "Balanced" and "The best" are relative. Budget confidence also varies enormously by country, from 21% unsure in Hong Kong to 73% in Pakistan.

Drawn from the dataset; the same figures are in the table. Select the chart to enlarge it.

SVG

All finishers (n = 10,907)
AnswerBarShare of visitors95% intervaln
Cheapest34.7%33.8% to 35.6%3,784
Balanced6.9%6.4% to 7.4%752
The best4.6%4.2% to 5.0%497
I'm not sure53.9%52.9% to 54.8%5,874

The "not sure" share before and after Aug 18, 2026

On August 18, 2026 the "not sure" option on this question changed: choosing it now shows a price hint before the visitor continues. The headline share pools both versions. Before the change 63.8% of 2,147 finishers chose "not sure"; since, 51.4% of 8,760 did. On the English homepage alone the figures are 65.6% of 1,844 before and 61.7% of 4,443 since. The audience also changed over these weeks (translated homepages launched, more countries), so the drop is not all the effect of the change.

Budget "not sure" by version of the quiz (UTC)
VersionFromFinishers"Not sure""Cheapest"
Launch version of the quiz.Jul 29, 20261,21566.1%24.6%
One-line descriptions under each option rewritten.Aug 10, 202693260.8%27.9%
Reworked how the budget question's "not sure" option works.Aug 18, 20266,61453.1%35.4%
Speed option added to the first question.Oct 4, 20261,80246.0%41.2%
Quiz shown to half of homepage visitors as part of a homepage test.Oct 15, 202634446.8%41.9%

5 · How answers connect

What people want tends to go together

Each row compares a group with the average finisher.

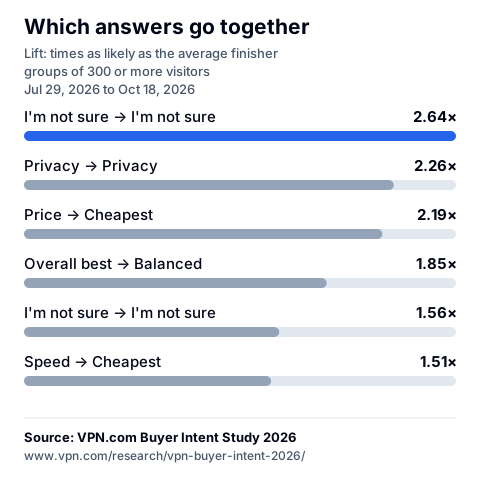
A lift of 2.0× means the group chose that answer twice as often as the average visitor. The tables list the strongest differences that hold up statistically, and only for groups of 300 or more.

The links are real but modest. The connection between use and priority is moderate (Cramér's V 0.24), between priority and budget moderate (0.27), and between use and budget moderate (0.14). These are patterns among answers given by the same visitor, not causes.

Drawn from the dataset; the same figures are in the table. Select the chart to enlarge it.

SVG

More likely
Visitors who chosewere more likely to chooseLiftGroup vs allGroup size
UseI'm not surePriorityI'm not sure2.64×52.1% vs 19.7%2,244
UsePrivacyPriorityPrivacy2.26×41.3% vs 18.3%2,083
PriorityPriceBudgetCheapest2.19×76.0% vs 34.7%1,851
PriorityOverall bestBudgetBalanced1.85×12.8% vs 6.9%870
PriorityI'm not sureBudgetI'm not sure1.56×83.8% vs 53.9%2,152
UseSpeedBudgetCheapest1.51×52.3% vs 34.7%325
UseGamingPrioritySpeed1.44×46.7% vs 32.5%1,538
UseSpeedPrioritySpeed1.42×46.2% vs 32.5%325
PrioritySpeedBudgetBalanced1.37×9.5% vs 6.9%3,541
UseStreamingPriorityPrice1.34×22.8% vs 17.0%2,007
Less likely
Visitors who chosewere less likely to chooseLiftGroup vs allGroup size
PriorityPriceBudgetI'm not sure0.30×16.1% vs 53.9%1,851
PriorityI'm not sureBudgetCheapest0.36×12.5% vs 34.7%2,152
UseI'm not surePriorityPrivacy0.44×8.0% vs 18.3%2,244

Use = What will you use a VPN for? Priority = What matters most in a VPN? Budget = What's your monthly budget? Answering "I'm not sure" on one question is the strongest sign of answering it on another.

6 · Where visitors were

Where you live changes what you want

Countries with 200 or more finishers. Treat a pooled share as a blend of different audiences, not one population.

Drawn from the dataset; the same figures are in the table. Select the chart to enlarge it.

SVG

Most common answers by country
CountryFinishersTop useTop priorityPrice firstBudget "not sure"
Pakistan1,373Privacy 32%Speed 38%6%73%
India1,125Security 24%Speed 36%10%70%
United States1,119Streaming 23%Price 26%26%36%
Indonesia1,015Privacy 37%Privacy 33%7%64%
China697Streaming 27%Price 44%44%22%
Hong Kong361I'm not sure 27%Price 40%40%21%
Iran239I'm not sure 27%Speed 54%16%48%
Bangladesh209Security 32%Speed 35%17%67%

Top use is the most common first answer among all visitors from that country; the other columns cover finishers. We do not record which page or ad sent each visitor, so a country difference may partly be a difference in traffic source.

7 · Completion

Three in four finish, and mobile visitors drop out more often

The median visitor took 11.6 seconds to answer.

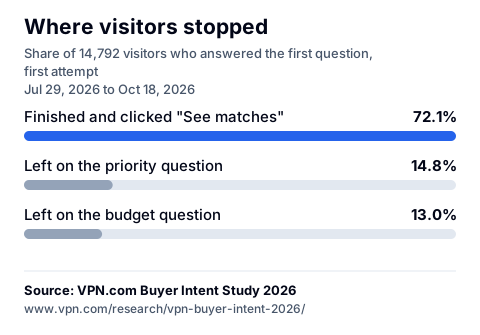
72% (10,670) of the 14,792 visitors who answered the first question went on to click "See matches" on their first attempt. 68.2% of mobile visitors did, against 77.5% on desktop, partly because mobile skews toward the countries that send the most visitors.

Counting a later attempt too, 10,907 visitors (74%) finished; the extra 237 left the first time and finished on a return. The rest of this page uses the 10,907, because each visitor counts once and a later finish is still a finish. The three outcomes in the table cover all but fewer than 10 visitors, who reached the last question and did not click "See matches".

The table by first answer shows how completion varies with where a visitor starts. These figures describe drop-off after a visitor commits to the first question; they are not a conversion rate for the homepage.

Drawn from the dataset; the same figures are in the table. Select the chart to enlarge it.

SVG

Overall (n = 14,792)
OutcomeBarShare95% intervaln
Answered all three questions and clicked "See matches"72.1%71.4% to 72.9%10,670
Left on the priority question14.8%14.2% to 15.4%2,190
Left on the budget question13.0%12.5% to 13.6%1,929
Finished, by device
DeviceBarFinished95% intervaln
Mobile68.2%67.2% to 69.2%5,851
Desktop77.5%76.5% to 78.6%4,819
Finished, by first answer
First answerBarFinished95% intervaln
Gaming80.0%78.2% to 81.8%1,497
Business74.7%70.3% to 78.6%316
Streaming73.5%71.8% to 75.1%1,970
I'm not sure72.3%70.6% to 73.8%2,196
Speed70.9%66.6% to 74.9%322
Security69.2%67.6% to 70.7%2,336
Privacy69.0%67.3% to 70.7%2,033

8 · What happened next

From answers to provider clicks

A click-out is a tracked click to a provider within seven days. It shows interest, not a purchase.

Across all finishers

31.2% of the 10,001 finishers who began at least seven days before Oct 19, 2026 made a genuine click-out within seven days (95% interval 30.3% to 32.1%).

The rate was 45.3% for those sent to a dedicated page and 22.8% for those sent to the general page. That gap mixes the page with the people, because the page depended on the first answer. Compare only visitors sent to the same page and a pattern remains: those who chose a "Balanced" budget clicked out 57.4% of the time, against 42.4% of those who said "I'm not sure" ("Cheapest": 47.1%). Naming a budget goes with stronger intent, though the quiz did not cause the click.

Click-out within 7 days by budget answer, visitors sent to a dedicated page
Budget answerBarClicked out95% intervaln
Cheapest47.1%44.6% to 49.6%1,510
Balanced57.4%51.4% to 63.2%263
The best44.7%38.1% to 51.5%208
I'm not sure42.4%40.2% to 44.5%1,992

What holds visitors back

From Oct 3, 2026 to Oct 19, 2026, shorter quizzes on our free-VPN, streaming, gaming and privacy pages asked what brought the visitor there and what their biggest hesitation was. They are a separate source and are never blended with the main quiz.

On the streaming, gaming and privacy pages, 36.4% of 533 visitors named "A free VPN might be enough" as their biggest hesitation about paying, more than price, speed or trust. And 68.0% of the 206 visitors on the streaming page said their show is only available abroad.

Visitors who finished the free-VPN quiz and clicked out went to the provider it had just recommended 85% of the time (171 clicks). That measures following a recommendation, not an independent preference.

"What is your biggest hesitation?" by quiz
QuiznNot sure what I should payA free VPN might be enoughWorried it will slow me downNot sure I can trust a VPN company
Free VPN quiz56718%46%16%17%
Streaming quiz18835%31%15%15%
Gaming quiz17224%40%20%14%
Privacy quiz17323%39%13%23%

The quiz offers four hesitations, so this ranks the ones we offered; it does not discover new ones. The streaming figure is a smaller sample, mostly from English- and Chinese-language pages.

One controlled experiment

Visitors were randomly sent either to a dedicated "best VPN for" page or to the general VPN page, so the gap in clicks is caused by the page. The other findings show patterns, not causes.

2.27×as many provider clicks from a dedicated page (95% interval 1.99 to 2.6)

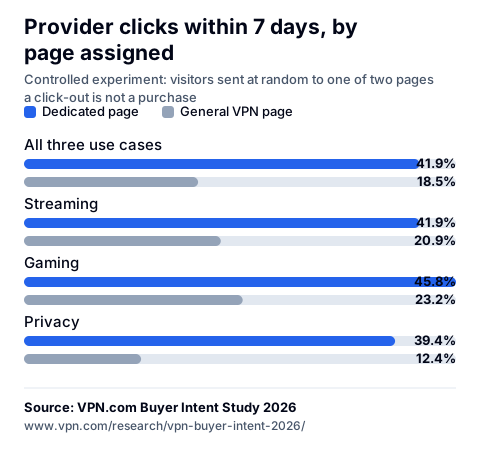
Between Jul 29, 2026 and Sep 7, 2026, visitors who picked streaming, gaming or privacy were sent at random, 50/50, to one of two pages after the quiz: a dedicated "best VPN for" page, or our general VPN page.

41.9% of the 1,230 sent to the dedicated page clicked out to a provider within seven days, against 18.5% of the 1,235 sent to the general page. Because the page was assigned by chance, the gap is the effect of the page.

Drawn from the dataset; the same figures are in the table. Select the chart to enlarge it.

SVG

Click-out within 7 days, by assigned page
First answerDedicated pageGeneral VPN pageRatio (95% interval)
All three use cases41.9% n = 1,23018.5% n = 1,2352.27× (1.99 to 2.6)
Streaming41.9% n = 40320.9% n = 4602.01× (1.63 to 2.48)
Gaming45.8% n = 33423.2% n = 3321.98× (1.57 to 2.48)
Privacy39.4% n = 49312.4% n = 4433.17× (2.42 to 4.15)

The test ended in September and the dedicated pages have been the only destination since. Each browser kept the same page for the whole test. The dedicated pages were for streaming, gaming and privacy visitors.

Cite this result

In a controlled experiment with visitors assigned at random, those sent to a dedicated "best VPN for" page clicked out to a provider 2.27 times as often as those sent to the general VPN page (41.9% vs 18.5%).

A click-out is a click to a provider, not a purchase.

In a controlled experiment with visitors assigned at random, those sent to a dedicated "best VPN for" page clicked out to a provider 2.27 times as often as those sent to the general VPN page (41.9% vs 18.5%). (VPN.com, VPN Buyer Intent Study 2026; n = 1,230; Jul 29, 2026 to Sep 7, 2026.) https://www.vpn.com/research/vpn-buyer-intent-2026/#stat-h17

9 · Methodology

How the data was collected and cleaned

The same analysis produces every number on this page and the downloadable dataset.

The questions, as visitors saw them and in the order asked
QuestionAnswer options, in order
1. What will you use a VPN for?
  1. Security
  2. Privacy
  3. Streaming
  4. Gaming
  5. Speed
  6. Business
  7. I'm not sure
2. What matters most in a VPN?
  1. Price
  2. Speed
  3. Privacy
  4. Simplicity
  5. Overall best
  6. I'm not sure
3. What's your monthly budget?
  1. Cheapest
  2. Balanced
  3. The best
  4. I'm not sure

The Speed option was added to the first question on Oct 4, 2026; earlier visitors did not see it. The wording of the questions did not change.

Research question. What do VPN.com visitors say they want from a VPN: what they would use it for, what matters most to them and what they would spend?

Sources. VPN.com's VPN finder quiz asks three questions: what the visitor would use a VPN for, what matters most and their monthly budget. A response is recorded when the first question is answered and updated with each later answer. Provider clicks come from VPN.com's affiliate click log, joined on the first-party visitor cookie that both surfaces read. A visitor's click-outs count as genuine only if that visitor left proof of having been on a vpn.com page (our page script ran, the browser named a vpn.com page as the referrer, or the visitor carried the landing-page cookie our site sets on a first pageview) and made no more than 20 click-outs in the study window. Visitors with no such proof, or with more clicks than that, are treated as automated and left out. Quiz responses have their own, simpler cleaning rules (see the table below). Test traffic is excluded. The shorter page quizzes are a second, separate source.

One visitor, one vote. The first question and drop-off use each visitor's first valid response (14,792 visitors). The second and third questions, every combination and every click-out figure use each visitor's first valid completed response (10,907 visitors). 9.3% of visitors took the quiz more than once; only the first counts.

Statistics. Shares carry 95% confidence intervals (Wilson). Lift is the share of a group choosing an answer divided by the share of all finishers choosing it. Each cell is tested against everyone else, with one false-discovery correction (Benjamini-Hochberg) across the combination tables, and each pair of questions is tested with a chi-square test and reported with Cramér's V, the effect size to read: with thousands of visitors almost any difference is statistically significant. Cells with n under 100 carry a dagger and are directional; counts under 10 are withheld. The confidence intervals describe sampling error only. They do not correct for self-selection (who chose to visit and to open the quiz) or for errors in how answers were recorded, so a narrow interval does not make a share representative of anyone beyond these visitors.

Conflict of interest. VPN.com earns an affiliate commission when visitors buy through our links, including some of the clicks this study measures. The study publishes only aggregated answers and click-out rates, and it ranks no provider. No provider paid for the study.

Ethics and consent. The quiz asks three questions and nothing else: no name, email address or free text. A response is linked to a first-party visitor cookie so that repeat takers and later provider clicks can be matched. That identifier is not published: the files contain aggregates only, with no visitor, session or response identifiers, no individual timestamps and every count under 10 withheld.

Reproducibility. The aggregates and the method are public in the dataset; the raw answers stay private to protect visitors' privacy. The analysis code that regenerates every number is not published; it is available on request to journalists and researchers at press@vpn.com.

Cleaning, in this order
RuleResponses
Quiz responses recorded in the period16,804
No visitor cookie, removed98
Visitors with 10 or more responses (8 visitors), removed134
Finished in under 2 seconds, removed76
No first answer recorded, removed5
Valid responses kept16,491
Versions of the quiz (UTC)
VersionFromChange
1Jul 29, 2026Launch version of the quiz.
2Aug 10, 2026One-line descriptions under each option rewritten.
3Aug 18, 2026Reworked how the budget question's "not sure" option works.
4Oct 4, 2026Speed option added to the first question.
5Oct 15, 2026Quiz shown to half of homepage visitors as part of a homepage test.

The wording of the three questions did not change after launch; the answer options changed once, when Speed was added to the first. What changed around them: the descriptions under each option, a budget hint, translated homepages and, most recently, a homepage test. Answer labels are quoted as visitors saw them.
10 · Limitations

Read this before you quote a figure

Based on visitors to VPN.com who used our VPN finder; not a census of all VPN users.

  1. Self-selected visitors, not a population survey. Everyone here chose to visit VPN.com and chose to open the quiz. Shares describe those visitors. They do not describe VPN buyers or people who want a VPN, and should not be quoted that way.
  2. The audience is not a Western consumer panel. Finishers come mostly from Pakistan, India, United States, Indonesia, China, and Hong Kong. Motives look different in different places, and pooled numbers are dominated by the largest countries.
  3. Bots and automation. Cleaning removed 308 responses (no cookie, very heavy repeat use, or finished in under two seconds). That catches obvious scripts only. A patient automated browser that varies its answers would not be detected in the quiz data. The click side applies VPN.com's stricter genuine-traffic rule.
  4. Wording and layout changed. Question text and answer options are stable, but the options around them changed (see the versions above). The Speed answer to the first question exists only since Oct 4, 2026, so its share is not comparable with earlier weeks, and other answers are slightly deflated by it in pooled tables.
  5. Order and default effects. Option order is fixed. The first option and "I'm not sure" may attract clicks regardless of intent. "I'm not sure" is treated as an answer, not a missing value.
  6. What the data cannot see. A response begins when the first question is answered, so people who saw the quiz and did nothing are invisible. Completion is not a homepage conversion rate, and abandoning the budget question cannot be told apart from finishing, which is one click.
  7. Cookies and consent. The quiz records through a first-party endpoint, so ad blockers do not remove responses. A consent regime can remove the visitor cookie: 0.6% of responses carry none (0.6% of the 1,260 from the EEA and UK), and those are excluded, so European counts are slightly understated. Where the cookie does not survive to the click, a real click-out is not matched to its response, and click-out rates are undercounted unevenly by country.
  8. Click-out is not purchase. A click-out is a click on a tracked link to a provider within seven days. It says nothing about buying. Treat it as interest, not revenue.
  9. One placement. This is the homepage quiz and its translated copies. The page quizzes are a different instrument and are not merged into these tables.
  10. Test traffic. The quiz stores the page path, not the host, so internal test responses cannot be filtered out by host. They are bounded by the cleaning rules above.
  11. Intervals are not a fix for bias. The confidence intervals describe sampling error only. They do not correct for self-selection (who chose to visit and to open the quiz) or for errors in how answers were recorded, so a narrow interval does not make a share representative of anyone beyond these visitors.
  12. Many comparisons. The combination tables test every cell. The corrected q-values account for that, and cells with n under 100 are marked directional and are not headline material.
  13. Associations, with one exception. Answers given by one visitor in one sitting are related, not caused by each other. The controlled experiment, in which visitors were randomly assigned to a page, is the only causal claim in this study.

11 · Cite and download

Use the data

Cite the study, a single statistic or the dataset. Each finding has its own link.

Cite the study

Gargiulo, M. (2026). VPN Buyer Intent Study 2026: what 10,907 VPN.com visitors told VPN.com's VPN finder quiz. VPN.com. https://www.vpn.com/research/vpn-buyer-intent-2026/ (data Jul 29, 2026 to Oct 18, 2026; dataset https://www.vpn.com/research/vpn-buyer-intent-2026/dataset.json)

The dataset

Title
VPN Buyer Intent Study 2026: aggregate dataset
Author
Michael Gargiulo, Founder, CEO & Lead Domain Broker, VPN.com
Publisher
VPN.com · version 1.0 · generated October 19, 2026
Format
JSON · 295 KB · vpn-buyer-intent-2026-dataset.json
Coverage
Jul 29, 2026 to Oct 18, 2026 · N = 14,792 visitors
Contents
Aggregates only: no visitor, session or response identifiers, no individual timestamps, and every count under 10 withheld. It is the file this page is drawn from.
Licence
Use is subject to the VPN.com terms.
How to cite
Gargiulo, M. (2026). VPN Buyer Intent Study 2026: aggregate dataset (version 1.0, JSON). VPN.com. https://www.vpn.com/research/vpn-buyer-intent-2026/dataset.json (data Jul 29, 2026 to Oct 18, 2026)
Download the dataset (JSON)

Changes to this page

Retitled as the evergreen study name with its scope, moved the headline findings into a Key findings box, added a chart for each section (enlarge or download, each carrying the source line), made the quiz screenshot enlargeable and added a press kit with ready-to-paste citations and a boilerplate. No figure changed.
Named the author and a press contact. Reworded "shoppers" to "visitors" where it overstated. Corrected the sample size shown on the country card and the "cheapest" share, which is now stated for all finishers and for those who named a budget. Explained the two completion figures and the three visitors missing from the outcome table. Added the budget "not sure" share before and after the 18 August change, the country pattern behind the Speed finding, a note on what the confidence intervals do not cover, a plain-words definition of genuine traffic and how to request the analysis code. No other figure changed.
Added the research question, status and conflict-of-interest disclosure, the three questions with every answer option as visitors saw them, an ethics and reproducibility note and this change log. No figure changed.
Version 1.0 published with the dataset.

See also our review methodology and the provider research ledger. To see what we would recommend for you, try the VPN finder on the homepage.

Data and methods
What is in the file
SectionContents
metaWindow, question wording and answer labels, wording periods, the suppression rule and the privacy statement.
dataQualityHow many responses were removed and why; repeat-taker share; median completion time.
distributionsEach of the three questions, overall and sliced by country, device, language, month and wording period.
associationsEvery pair of questions: counts, conditional shares, lift, 95% intervals, p and BH-corrected q, Cramer's V.
strataCheckThe same association tests repeated inside each country, to check it is not one country's effect.
threeWayUse x priority x budget combinations (counts under 10 withheld).
dropoffWhere visitors stopped, by first answer, device, language, country and wording period.
behaviourClick-outs within 7 days, by answer and by destination page, plus the randomised destination test.
clickJoinHow the click source was joined and which traffic classification was used.
quizSessionsThe separate per-page quizzes (free, streaming, gaming, privacy, speed, business).
headlinesThe 22 citable statements with n, range, method and caveat, as generated by the analysis script.

The Privacy priority is stored under the key trust; its visitor-facing label is "Privacy". Every row carries both the key and the label.

The analysis is read-only against the source tables and regenerates this page's numbers:

node scripts/analysis/advisor-research.mjs --until 2026-10-19

12 · Press kit

Press kit

Statistics with citations to paste, charts to download, a boilerplate, the press contact and how to cite.

Five statistics to quote

  1. 32.5%

    32.5% of the 10,907 visitors who finished put Speed first, ahead of Privacy (18.3%) and Price (17.0%). (VPN.com, VPN Buyer Intent Study 2026; n = 10,907; Jul 29, 2026 to Oct 18, 2026.) https://www.vpn.com/research/vpn-buyer-intent-2026/#stat-h05

  2. 53.9%

    53.9% of 10,907 finishers answered "I'm not sure" when asked for a monthly budget; 34.7% of all finishers picked the cheapest option. (VPN.com, VPN Buyer Intent Study 2026; n = 10,907; Jul 29, 2026 to Oct 18, 2026.) https://www.vpn.com/research/vpn-buyer-intent-2026/#stat-h06

  3. 20.5%

    20.5% of 14,792 visitors chose "I'm not sure" when asked what they would use a VPN for. (VPN.com, VPN Buyer Intent Study 2026; n = 14,792; Jul 29, 2026 to Oct 18, 2026.) https://www.vpn.com/research/vpn-buyer-intent-2026/#stat-h04

  4. 31.2%

    31.2% of visitors who finished the quiz clicked through to a provider's site within seven days. (VPN.com, VPN Buyer Intent Study 2026; n = 10,001; Jul 29, 2026 to Oct 18, 2026.) https://www.vpn.com/research/vpn-buyer-intent-2026/#stat-h18

  5. 2.27×

    In a controlled experiment with visitors assigned at random, those sent to a dedicated "best VPN for" page clicked out to a provider 2.27 times as often as those sent to the general VPN page (41.9% vs 18.5%). (VPN.com, VPN Buyer Intent Study 2026; n = 1,230; Jul 29, 2026 to Sep 7, 2026.) https://www.vpn.com/research/vpn-buyer-intent-2026/#stat-h17

Charts

One per section. Each image carries the line "Source: VPN.com Buyer Intent Study 2026". Download as PNG or SVG.

  • What visitors would use a VPN for. Security: 22.8%; Privacy: 19.9%; Streaming: 18.1%; Gaming: 12.6%; Speed: 3.1%; Business: 2.9%; I'm not sure: 20.5%.

    What visitors would use a VPN for

    SVG

  • What matters most in a VPN. Speed: 32.5%; Privacy: 18.3%; Price: 17.0%; Overall best: 8.0%; Simplicity: 4.6%; I'm not sure: 19.7%.

    What matters most in a VPN

    SVG

  • What visitors would spend each month. Cheapest: 34.7%; Balanced: 6.9%; The best: 4.6%; I'm not sure: 53.9%.

    What visitors would spend each month

    SVG

  • Which answers go together. I'm not sure → I'm not sure: 2.64×; Privacy → Privacy: 2.26×; Price → Cheapest: 2.19×; Overall best → Balanced: 1.85×; I'm not sure → I'm not sure: 1.56×; Speed → Cheapest: 1.51×.

    Which answers go together

    SVG

  • Visitors unsure of their budget, by country. Pakistan: 73%; India: 70%; Bangladesh: 67%; Indonesia: 64%; Iran: 48%; United States: 36%; China: 22%; Hong Kong: 21%.

    Visitors unsure of their budget, by country

    SVG

  • Where visitors stopped. Finished and clicked "See matches": 72.1%; Left on the priority question: 14.8%; Left on the budget question: 13.0%.

    Where visitors stopped

    SVG

  • Provider clicks within 7 days, by page assigned. All three use cases: Dedicated page 41.9%, General VPN page 18.5%; Streaming: Dedicated page 41.9%, General VPN page 20.9%; Gaming: Dedicated page 45.8%, General VPN page 23.2%; Privacy: Dedicated page 39.4%, General VPN page 12.4%.

    Provider clicks within 7 days, by page assigned

    SVG

About VPN.com

VPN.com is a research and review platform helping people find trusted privacy and security solutions. We also operate as a premium domain brokerage, connecting businesses with category-defining domain names. VPN.com has reviewed 50+ VPN providers.

Press contact

press@vpn.com, for questions about the study and for the analysis code on request.

How to cite

Credit the study as "VPN.com Buyer Intent Study 2026" and link to https://www.vpn.com/research/vpn-buyer-intent-2026/. Quote a share with its sample size (n) and say that it describes visitors to VPN.com who used the quiz, not VPN buyers in general. Every chart image carries the source line; keep it in the picture when you reuse one.

Gargiulo, M. (2026). VPN Buyer Intent Study 2026: what 10,907 VPN.com visitors told VPN.com's VPN finder quiz. VPN.com. https://www.vpn.com/research/vpn-buyer-intent-2026/ (data Jul 29, 2026 to Oct 18, 2026; dataset https://www.vpn.com/research/vpn-buyer-intent-2026/dataset.json)